Analog Simulation
Qucs-S can perform a number of different common analog circuit simulation tasks. This page does not seek to be a step-by-step tutorial on each simulation type, but rather a brief overview of Qucs-S’s capabilities, with links to more in-depth resources.
DC Operating Point Simulation
A DC Operating Point simulation is the simplest type of circuit simulation. It does not look at transient/alternating current signals at all, but only considers DC circuit elements. A DC operating point simulation will simply output DC bias voltages for each electrical net in your schematic, and output currents for DC sources in your schematic. This is the same type of simulation as the .op command in other SPICE-based simulators, such as LTSpice.
There are two ways to make Qucs-S perform a DC operating point simulation:
Place any other type of simulation component on your schematic. A DC operating point simulation will be included automatically.
Place the dedicated “DC Simulation” component on your schematic. Use this if a DC simulation is the only type of simulation you wish to perform.
Method 1: DC Simulation in Addition to Other Simulation
When any other simulation command (such as Transient, AC, etc) is called on your circuit, Qucs-S will also perform a DC analysis automatically. To view this DC analysis data, either use the Simulation > Calculate DC Bias menu button, or push the F8 key. This will cause the DC bias voltages and currents to display directly on your schematic page, as in the figure below.

A simple resistive voltage divider, with a transient analysis being performed, and the DC bias data displayed on the schematic. Note the menu button to turn on the DC bias display on the schematic page.
Method 2: DC Simulation Only
If you only wish to perform DC simulation on your circuit, you can place the “DC Simulation” component on your schematic. This will ensure DC simulation occurs when you run the simulation.
You will still need to use the Simulation > Calculate DC Bias button, or push F8, to display the DC simulation results on your schematic page.
An example of a DC-only simulation is shown below.

A simple resistive voltage divider, with a DC analysis being performed, and the DC bias data displayed on the schematic. Recall that you must click Simulation > Calculate DC Bias or push the F8 key to display the DC bias data on the schematic.
Transient Simulation
Another very common type of simulation is the Transient simulation. This is a simulation of a dynamic circuit’s behavior across a specified amount of time. DC, AC, and totally nonperiodic signals can be modeled in a Transient Simulation.
The example below shows a single square pulse exciting an LC filter, using a 5 millisecond transient simulation.

A simple LC filter, being excited by a single 10V pulse with a duration of 1ms. The input voltage is graphed in red, while the output voltage is graphed in violet. These results came from the Transient Simulation command shown in the figure, which has a duration of 5 milliseconds.
Transient simulations have 4 major parameters:
Sweep Type: This determines whether the time in the simulation proceeds linearly (
lin), logarithmically (log), or via a user-defined list of discrete time points (list).Start Time: Typically this is left at
0. You may wish to set this to some offset value to control the initial conditions of your circuit.Stop Time: Your transient simulation will end at this absolute time. If your Start Time is set to
0, this represents the duration of your simulation.Step and Number: These control the time-steps used during the simulation. The Step parameter tells the length of one simulation step, and the Number parameter tells the total number of simulation steps. The two parameters are linked, so changing one will cause the other to recalculate.
The figure below shows the most important parameters for a Transient Simulation. Additional parameters can be configured on the Properties tab, but that is currently outside the scope of this documentation.
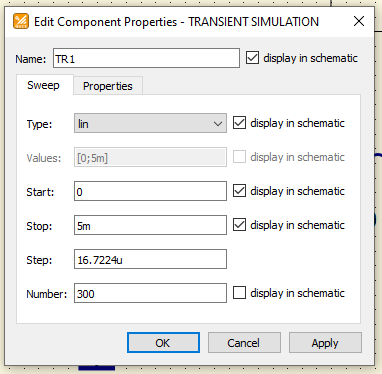
An example of the major properties in a Transient Simulation.
AC Analysis Simulation
Qucs-S can also perform small-signal AC analysis to characterize a circuit’s performance in the frequency domain. This is analagous to the .ac command in LTSpice, and other common SPICE circuit simulators.
This simulation sweeps fixed-magnitude sinusoidal source(s) (either voltage or current sources can be used) across a set frequency range, to test your circuit’s frequency response.
To do this, place an “AC Simulation” component on your schematic page, and configure the following parameters:
Type: This determines whether the frequency in the simulation proceeds linearly (
lin), logarithmically (log), or via a user-defined list of discrete frequencies (list).Start: Defines the start frequency.
Stop: Defines the stop frequency.
Points: Defines the number of discrete frequency points to simulate.
In addition to placing the AC Simulation component, you must also make sure you have at least one AC source in your schematic. These are the only sources which will be frequency-swept by the AC Simulation - other source types will be unaffected. AC Voltage or AC Current sources are available in Qucs-S, as shown in the figure below.
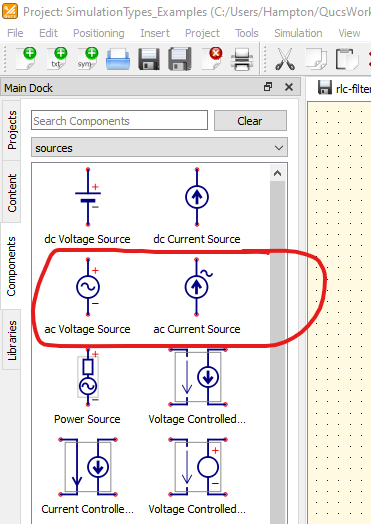
AC Current and AC Voltage sources, available via the “Sources” category in the “Components” tab, in the Main Navigation Dock. You must have at least one AC Source in your circuit to perform an AC Simulation, since these are the sources that will have their frequencies swept by the AC Simulation.
An example of an AC Simulation is shown in the figure below.

An example of a simple AC simulation. Note that it is possible to graph magnitude in dB, graph phase, and other more advanced features by utilizing the Equations feature.
Warning
In the example above, the absolute voltage at the circuit’s output is being graphed directly. However, it is more common in AC analysis to graph the ratio of the output to the input, usually in dB. In this example, that would be dB( v(filter_out)/v(filter_in) ).
Qucs-S can do this, but it requires an additional step of utilizing the Equations feature. Exactly how to do this depends on which simulation backend you are using.
Equations also make it possible to graph in dB, graph the signal’s phase in addition to the magnitude, and many other additional features. See the documentation on Equations for more information.